The mapping feature in Limble is great once you starting using it but taking the first step can be disorienting. Here are the ways I’ve mapped out our campus that might help point you in the right direction (I won’t use any more mapping puns, I promise).
Buildings/Rooms
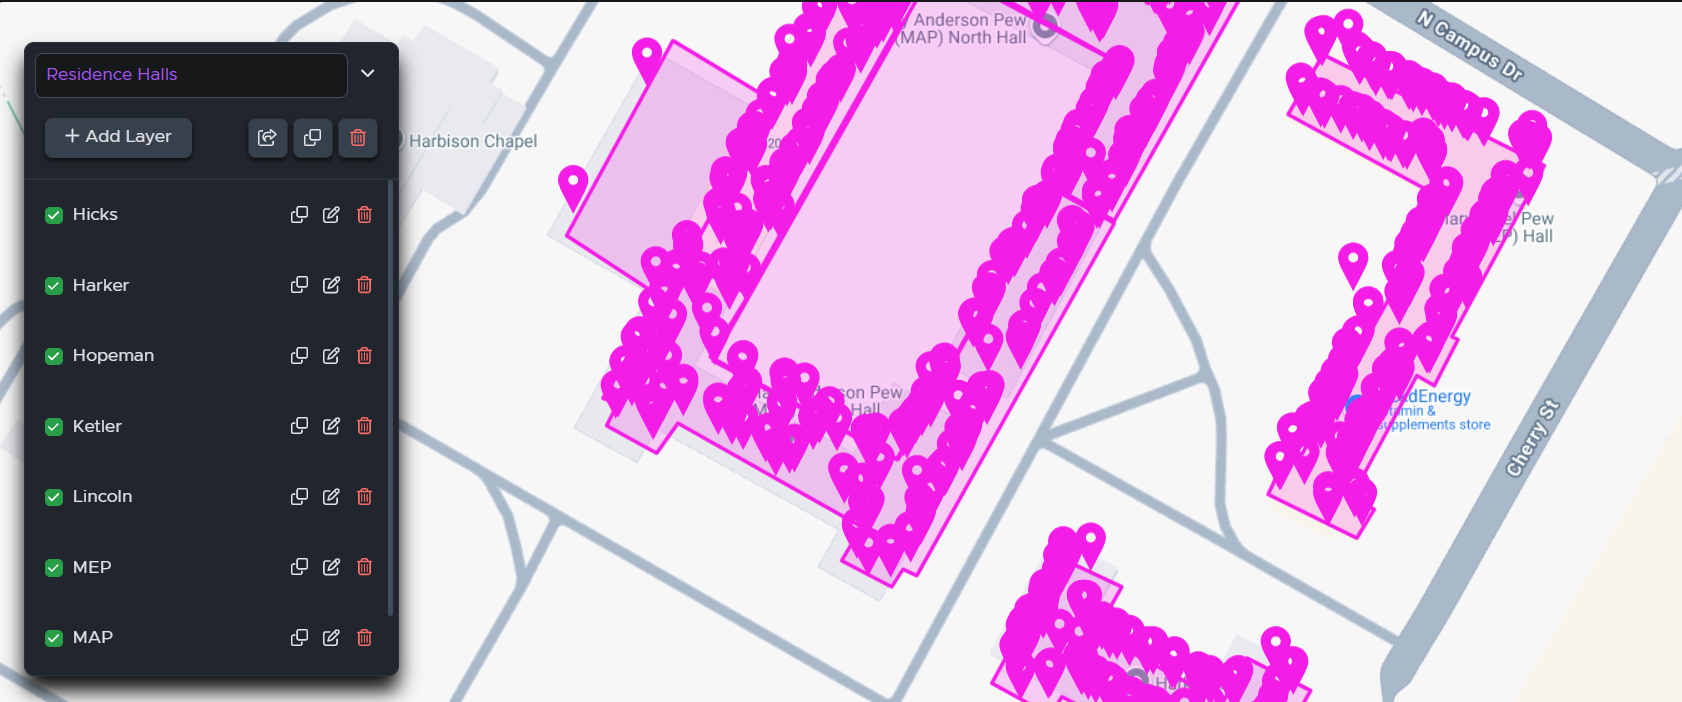
This was the first thing I mapped out when I got started. I created an area for each building and dropped a pin for each room. This can be monotonous so I suggest only doing a small amount at the beginning or the end of each day. Over the course of a couple weeks I was able to drop pins for all 30+ buildings on campus. Now each work order tied to a building/room is easy to find directly from the work order. Great for new employees who can’t even find their shadow!
Open Work Orders
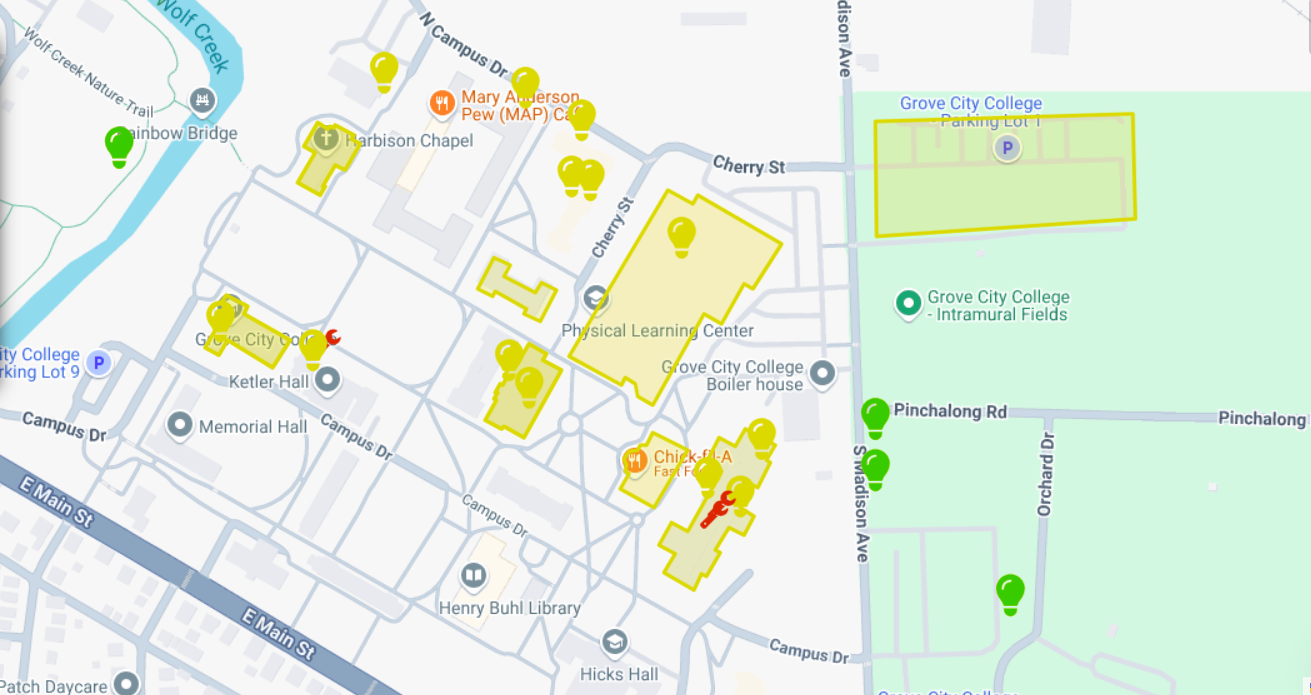
This one might seem obvious but it’s still worth pointing out. Creating a map with open work orders can show locations/buildings that have multiple things needing accomplished. This can save trips back and forth if you take what you need for tasks that are near each other. Add layers by tags or types of work so you can color code for an easy to read visual.
Lamp Posts
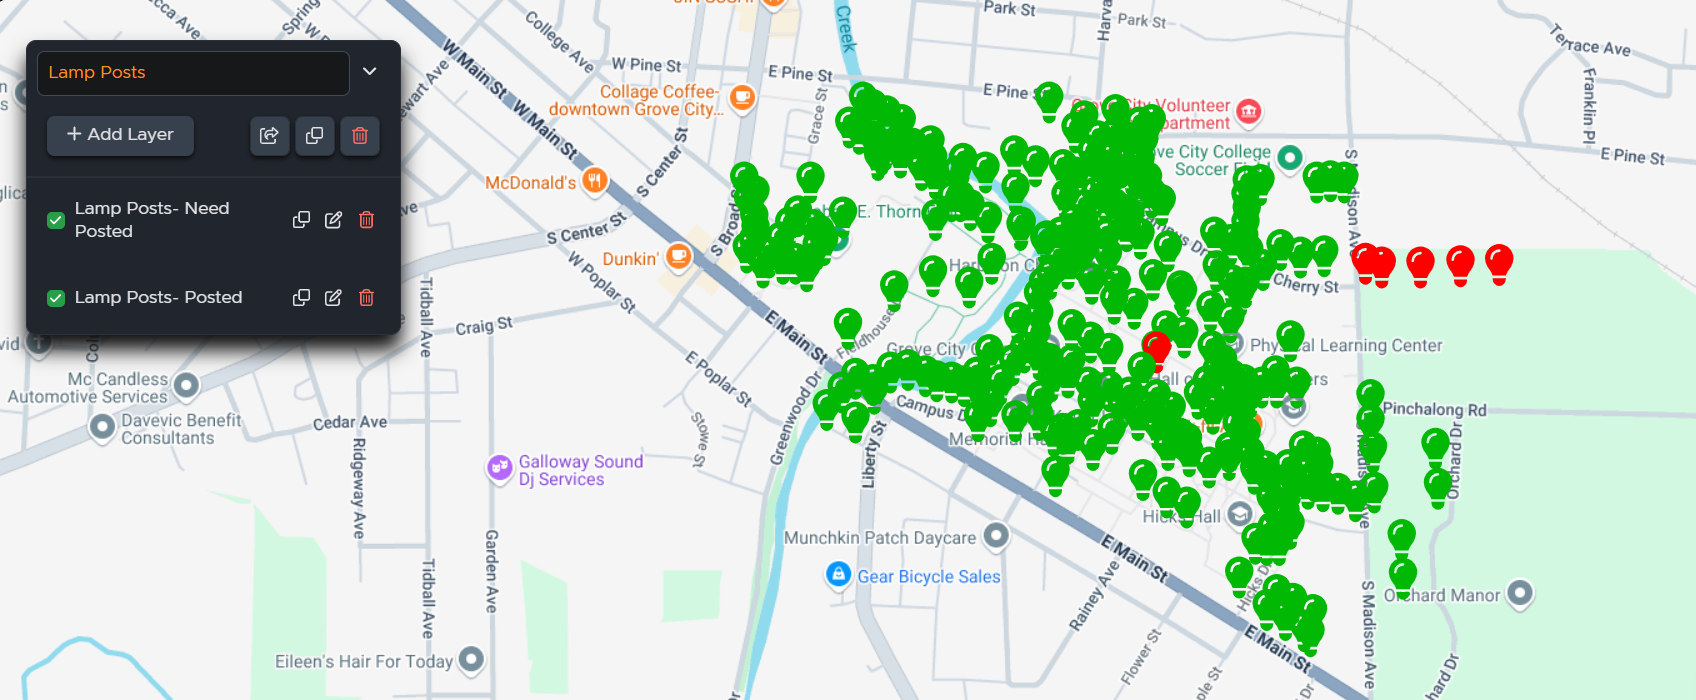
Did you know there are almost 300 lamp posts on our campus? I certainly didn’t when I started mapping them out. I used our AutoCAD files and the satellite imagery in the mapping feature to find them and drop a pin on each one. Furthermore, I created a QR code for each one using a laser engraver so campus safety can scan them and submit a work order when the lamp post is burned out. No more describing the light as “20 degrees southwest by about 60 feet”. Now maintenance can see on a map where it is and even track what bulb they need to replace. Major time saver!
Zones
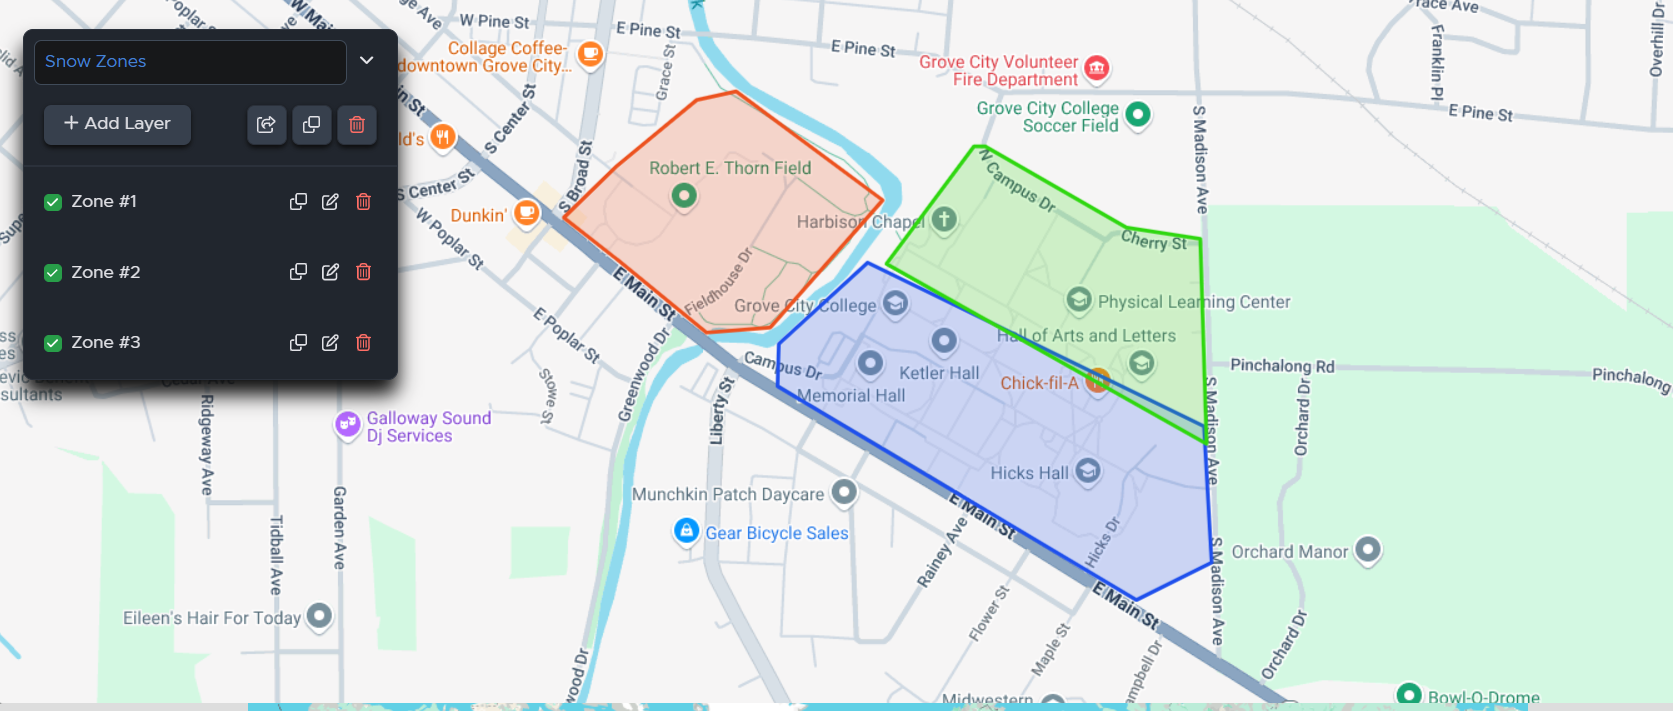
Make a new asset folder and add zones to that folder. Then you can add them to the map to overlay who is responsible for what. We use this to create snow zones on campus. This shows a visual of who is responsible for what space so if you find an issue then you know who to call or check the work order for.
Utility Lines
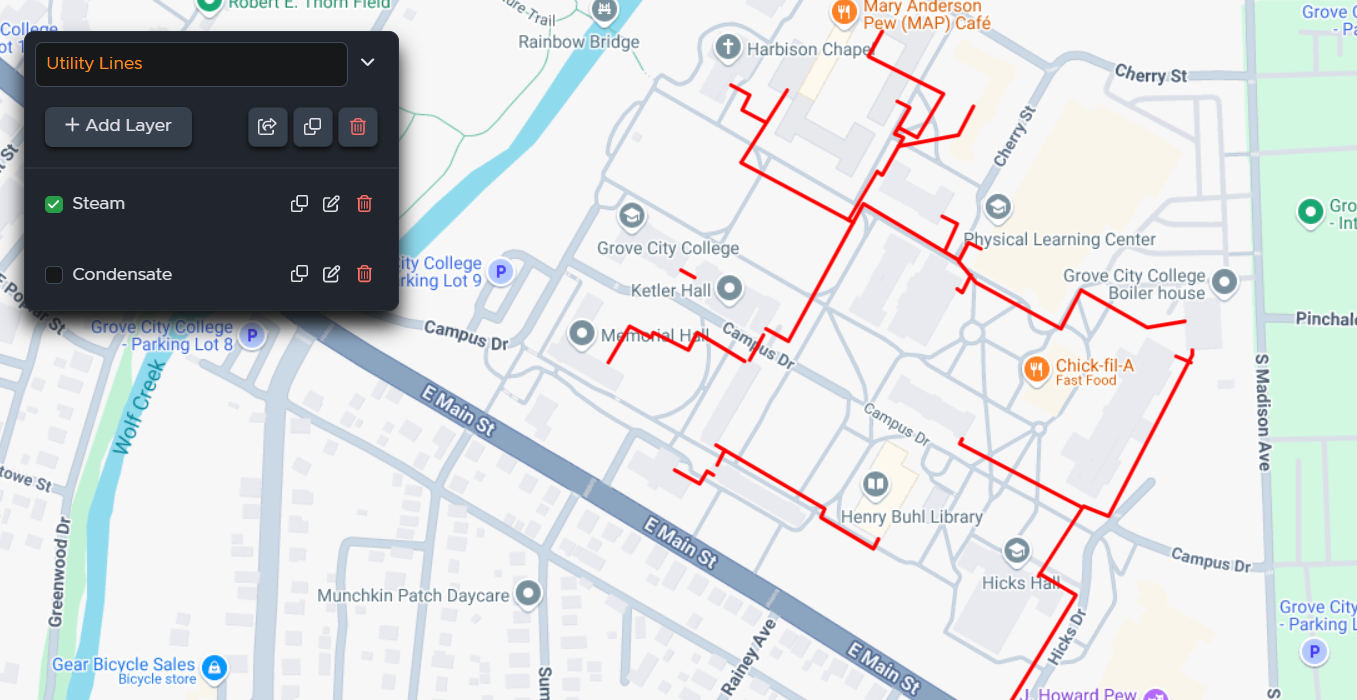
Have you tried all the items listed above and are thinking “geez, those were easy, I want a challenge”. Well friend, welcome to the challenge level. Limble allows mapping to create one continuous line for each asset so I am currently creating a group of assets for each underground line:
- Electric
- Gas
- Steam
- Condensate
- Chilled water
- Sewer
- Storm Water
- Communications
Draw a line for each asset and try and make them connect as best you can. Create a map layer and isolate the assets to only that utility. Then check the map and adjust the lines until they look like you think they should. The lines are estimates but they allow our contractors and technicians to see what to plan for when digging is needed.
This is what I’ve come up with so far. What else can we be mapping?